Making infographics is always fun to do, I’ve done so many of them. Telling a company’s story visually can be a challenge, but the payoff of someone understanding a concept visually is worth it. The first two were for an oil company–for an annual report. The rain one ws an explainer for a rare rainstorm.

For Shell Canada,an infographic depicting oil prices, done in Adobe Illustrator.

For the City of Calgary, an explainer infographic talking about how a part of the city got flooded during the 2013 floods.
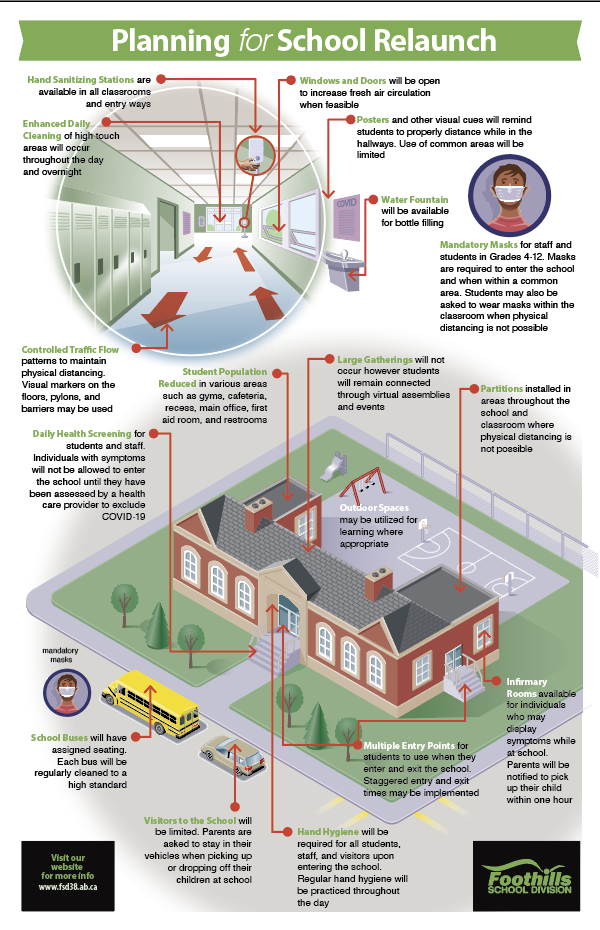


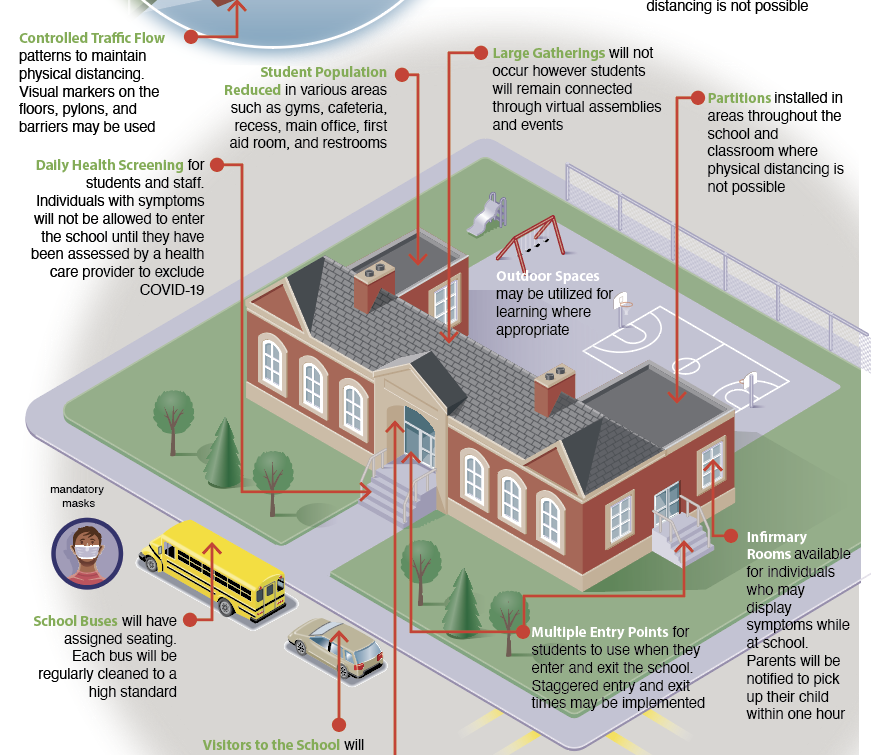
When a school district was returning after the pandemic they had me create this infographic to explain the new normal.
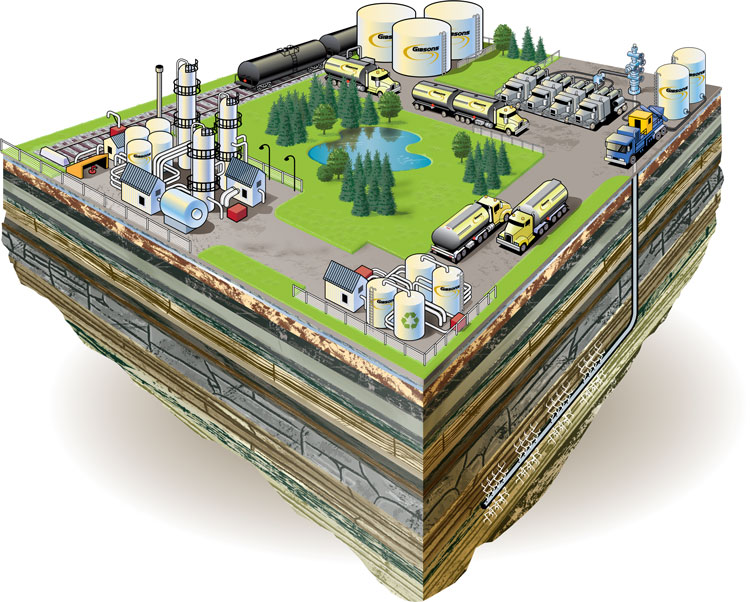
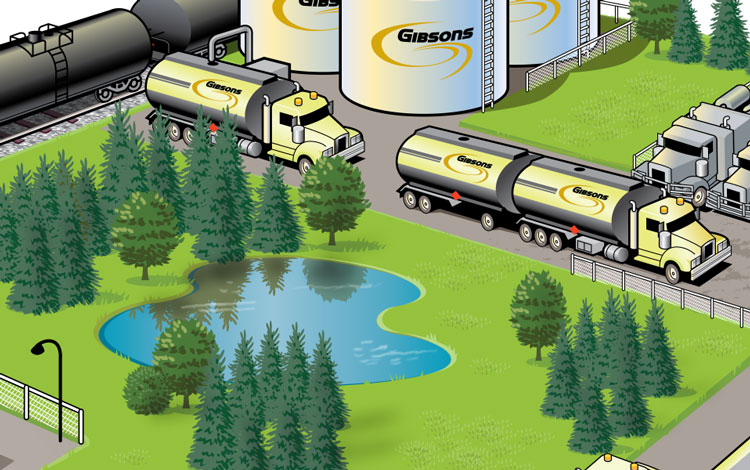

The folks at Tag advertising had me help out with this explainer illustration of processes in their company. It was done as a vector illustration for use in a variety of applications. I learned a lot about Gibsons in the process.

I love doing the vector isometric explainer illustrations. This one breaks down how solar electricity generation works. It’s a topic close to my heart because our home is solar and we love it. The image is all vector in Adobe Illustrator.

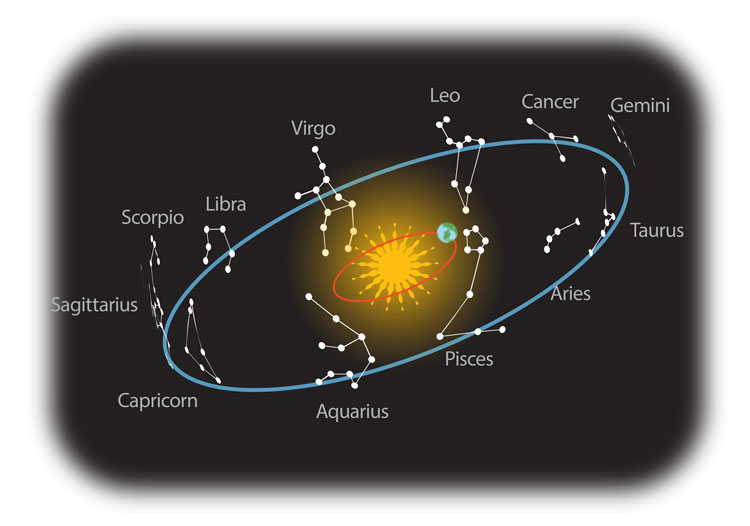
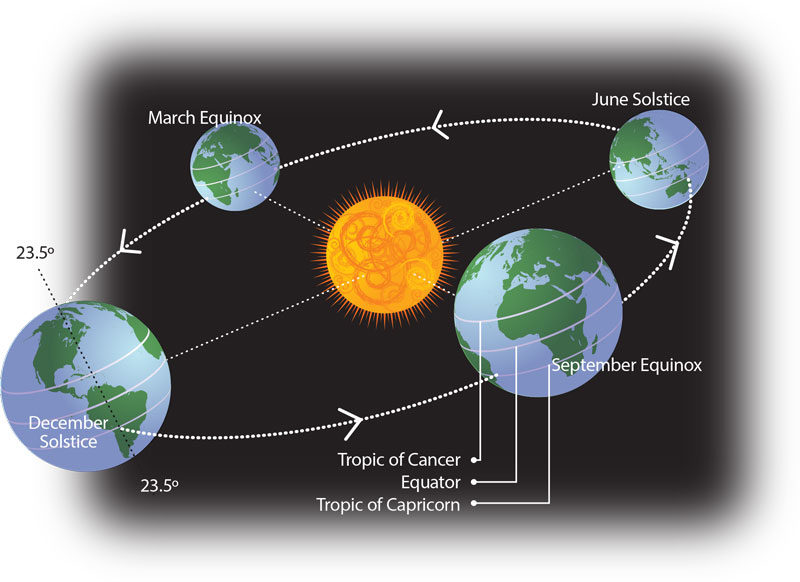
These were part of a series of about 100 drawings that the author of the book they’re for; tries to explain the universe and our relationships with its forces.